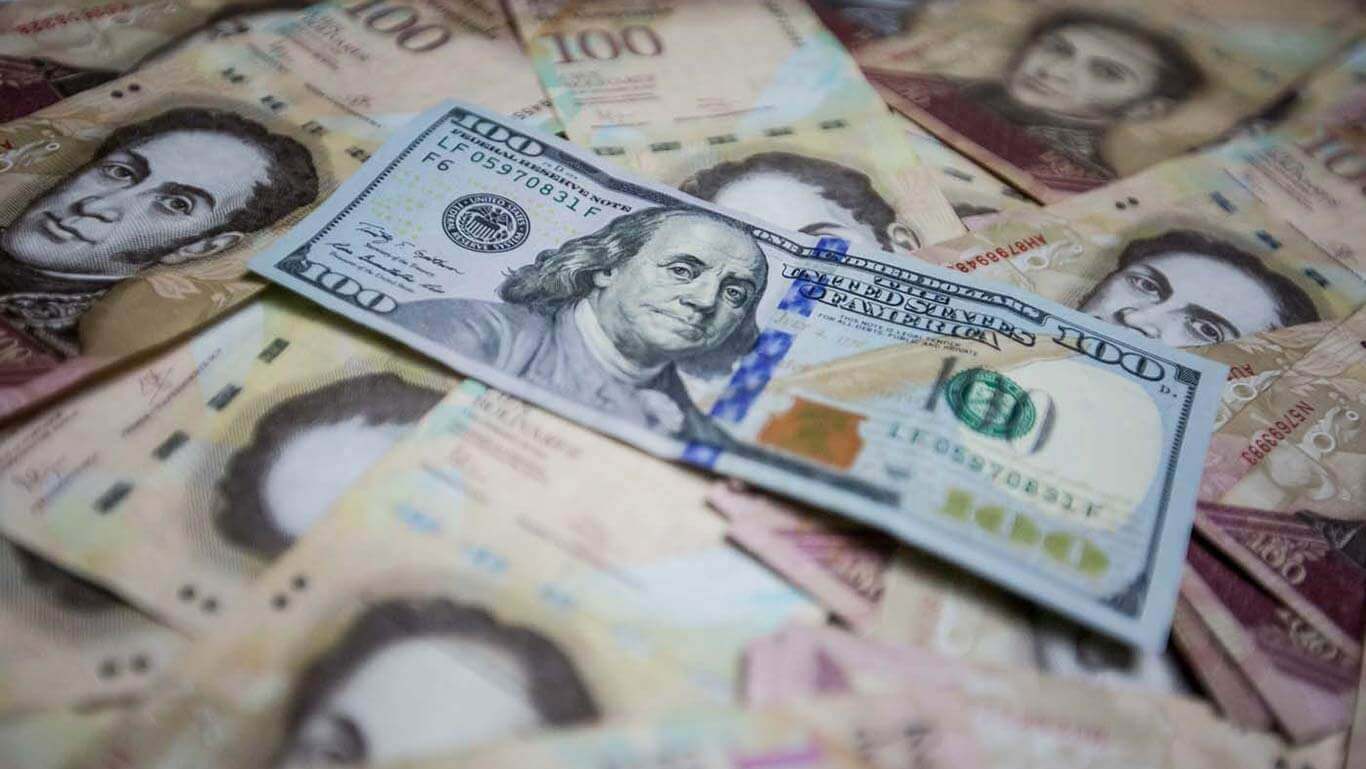
Lasting 37 months, Venezuela’s hyperinflation was the third longest episode documented in world history. In the end, Venezuelans shifted away from local currency into dollars to protect their savings, eroding the capacity of the government to fund itself through inflation. Hyperinflation came to an end not because the government chose to stop printing money, but because runaway inflation eroded its ability to pay for spending through the printing press.
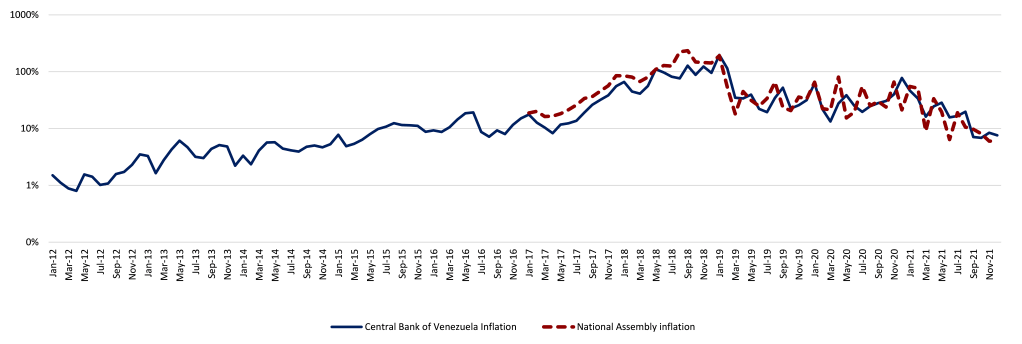
Venezuela’s hyperinflation came to an end at the close of December 2020, at least according to a widely used criterion used to measure hyperinflations originally suggested by Phillip Cagan in 1956 applied to data published by the Central Bank of Venezuela (BCV). The Cagan criterion classifies an economy as entering hyperinflation when its monthly inflation rate exceeds 50% and exiting when it goes below 50%, as long as that level is sustained for the following twelve months. By this criterion, Venezuela entered hyperinflation in December 2017, when its inflation rate first registered at above 50% (55.6%) and left after its last print above 50%, which had been in December 2020 (77.5%). However, we had to wait for an additional 12 months of below-50% prints to verify that it was out of hyperinflation. [1]
According to an alternative measure originally compiled by the Finance Commission of the National Assembly elected in 2015 (2015AN) and now published by the opposition-leaning Venezuelan Finance Observatory (OVF), the country is still formally in hyperinflation but we will almost certainly be able to verify that it exited at the end of February of this year. The 2015AN-OVF data times Venezuela’s entry into hyperinflation as of November 2017 (56.7%) and its last month of above-50% inflation as February 2021 (50.9%). As long as the OVF February 2022 print is less than 50%, we will be able to confirm that the country exited hyperinflation a year ago.
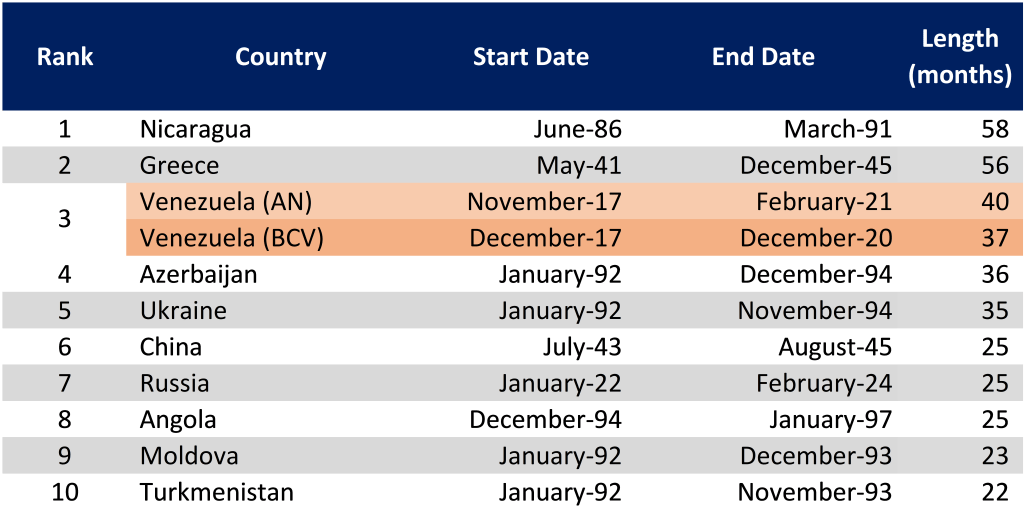
Regardless of what data you prefer to use to measure Venezuelan prices, it is clear that the country is no longer facing the traumatic monthly triple-digit price rises that it saw towards the end of 2018. Venezuela’s hyperinflation thus lasted 37 months according to the BCV data, or 40 months according to the 2015AN-OVF series. Either figure makes it the world’s third-longest documented hyperinflation, after Nicaragua (58 months) and Greece (56 months) (see Table 1)[2].
TABLE 1: LONGEST-LASTING HYPERINFLATIONS BY COUNTRY
The fact that Venezuela’s registers as one of the longest hyperinflations in world history by itself should caution us to the fact that, in searching for an explanation to its end, we should be looking not so much at what the country got right to stop it as what it got wrong in not being able to bring it to a close much earlier.
Figure 1: Monthly inflation rate, 2013-2020 (log scale)
THE RISE AND FALL OF RUNAWAY PRICES
Hyperinflations are episodes during which monetary authorities lose control over prices. Usually this is preceded by often very long periods of inflation that is very high but does not broach the 50% monthly inflation threshold. As inflation reaches very high levels, economic actors start doing whatever is within their reach to protect their wealth from the loss of value of the currency. This includes migrating to other assets that may more effectively preserve the value of their savings, such as fixed assets and other currencies like the U.S. dollar. It also includes holding money for shorter periods of time than in the past and entering into economic transactions designed to be consistent with those shortened intervals.[3]
Hyperinflations are always accompanied by high levels of money creation. This is true as a result of an accounting identity known by economists as the equation of exchange (linking money holdings, prices, output and the velocity of money, see Bordo, 1989), regardless of any more fundamental channels of causation. It is basically impossible to have prices increase very rapidly unless the amount of money used to pay for goods is also rising exponentially. But this also means that as an economy undergoes the acceleration in inflation that ultimately ends in hyperinflations, governments are reaping significant benefits from money printing.
Economists distinguish between seigniorage and the inflation tax (Drazen, 1985). Seigniorage is the total financing that the government obtains through inflation; the inflation tax is the loss in the value of people’s real money holdings as a result of inflation. The difference between them is the increase in real money holdings that people are willing to hold. For example, in an economy with zero inflation and positive real growth, demand for money will increase over time because of people’s need to carry out more economic transactions, so that real money holdings will increase and seigniorage will be positive even though there is no inflation. Similarly, in an economy that is contracting, pure seigniorage can be negative, and the government’s ability to tax money holdings through inflation ends up compensating for its reduced ability to fund itself from people’s need to hold more cash.
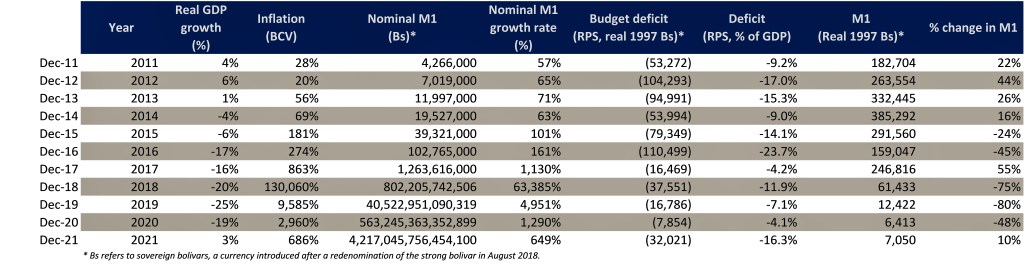
TABLE 2: INFLATION, MONEY SUPPLY, GDP GROWTH AND BUDGET DEFICIT, 2011-2021
Governments can reap significant levels of revenue from printing money. As Table 3 shows, at its peak in 2017, seigniorage contributed 11.4% of GDP to the government budget, thus paying for 28.5% of public sector expenditures. Of course, this also means that the amount that is being extracted from contributors (i.e., holders of assets denominated in local currency that lose value because of inflation) is huge, creating sizable incentives to avoid this tax. The simplest way to avoid the tax is, of course, by holding and using as little local currency as possible. In other words, an increase in inflation leads to declines in the demand for money which themselves undermine the capacity of the inflation tax to be used as a source of financing government expenditures.
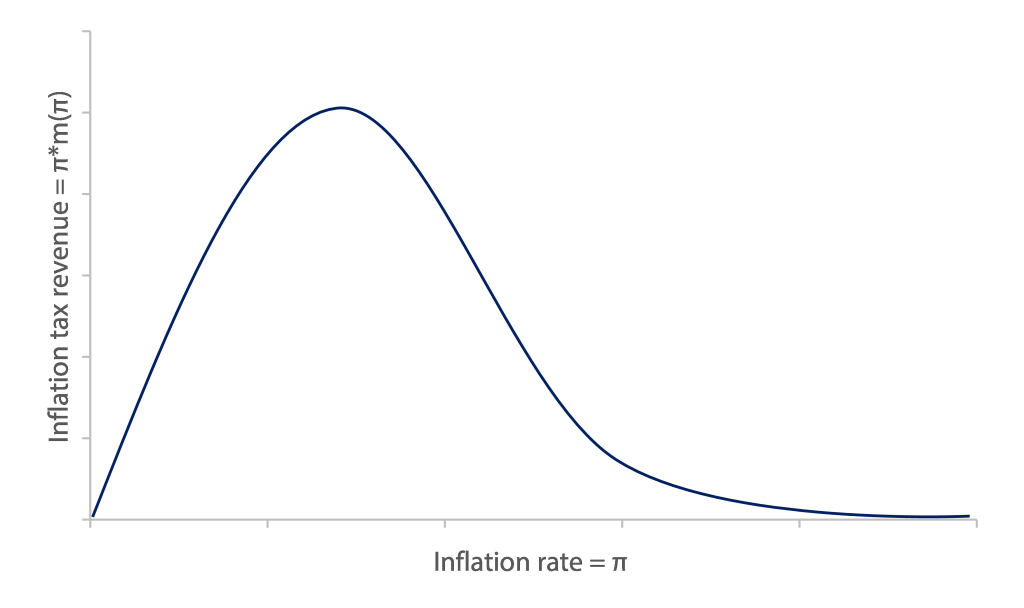
This is simply the concept of the Laffer curve applied to the inflation tax.[4] The Laffer curve is the mathematical relationship between tax collection and tax levels. Laffer curves capture the fact that at low levels of taxation, tax collection is increasing in taxes and at high levels of taxation the relationship becomes a decreasing one. The logic is simple: it is mathematically necessary for tax collection to be increasing when you raise taxes from zero to any level, because at a zero tax rate, tax collection is also zero. But tax collection will also likely be zero or close to it at a tax rate of one or greater (e.g., if you taxed 100% of income there would be no reason for anyone to work).
We should ask not so much what Venezuela got right to stop hyperinflation as what it got wrong in not being able to stop it much earlier.
The same logic applies to inflation taxes, though with a vengeance. If you unexpectedly raise inflation to high levels today, you will likely be able to reap very high levels of inflation tax as a result, but you will also lead to a substitution away from the local currency that will generate a decline in real money holdings and thus in your ability to fund yourself by taxing them through money printing. In other words, the inflation tax is the result of applying today’s inflation to today’s money holdings, but today’s money holdings are, to an important extent, a function of yesterday’s inflation levels. Therefore, a government can finance high levels of spending through inflation for only a limited period of time. After a while, the decline in the demand to hold money will fall so rapidly that the government’s ability to fund itself through this mechanism will evaporate.
Hyperinflation becomes full-blown when the government falls into the downward-sloping segment of the inflation Laffer curve so that further increases in inflation rates lead to declines in money demand that are so rapid that the capacity to fund government expenditures declines rather than increase. When this happens, people are literally trying to get rid of money faster than the government can print it. Therefore, the government is incapable of sustaining real high levels of government spending no matter how much it tries to do so.
Figure 2: Inflation Tax Laffer Curve
The consequence is felt more directly in the evolution of government wages. As in most other developing countries, wages in Venezuela are one of the most important items in the government budget. During episodes of high inflation, governments print money partly to try to preserve the real value of government salaries. But when the government is on the downward-sloping segment of the inflation Laffer curve, prices are increasing more rapidly than the government can print money, so real government wages end up declining regardless of how much money the government prints. The end result is that real government wages collapse and, with it, the real expenditures of the public sector. This is the essence of the hyperinflationary adjustment: in the end, government spending is brought down because of the government’s inability to continue paying for it with the inflation tax.
PICKING YOUR POISON
Hyperinflations are often said to result from the government’s decision to run high government deficits. This may be an excessively simplistic explanation. Governments can fund high deficits either by borrowing or by depleting assets, and when they do so, high deficits will not lead to money creation. Unsustainable deficits may lead to money creation eventually – when the government or other actors prove unwilling or unable to continue financing it – yet that is a much more complex causal hypothesis (and in any case, unsustainable deficits will by definition never be sustained indefinitely). Furthermore, the fact that deficits that are not financed by borrowing or asset depletion must be paid through the printing of money is not a causal explanation – it is an accounting identity.
A different way to think about hyperinflation is as a decision by governments to appeal to high levels of inflation tax to pay for their spending. In other words, hyperinflations result from choosing a particular mix of tax instruments. Governments can choose both spending levels and what taxes they will use to fund it, including borrowing (i.e., taxes on future contributors). Some governments choose inflation taxes that lead over time to declines in money demand. Very high levels of inflation tax are typically only available for short periods of time and help erode the real value of spending, for the reasons we have discussed. That means that high inflation taxes today will also typically mean low spending levels tomorrow.
To understand what causes hyperinflations, we need to know what type of governments will typically opt for financing spending through the inflation tax. Inflation taxes are temporary and highly distortionary but have a particular advantage: their benefits tend to be perceived before their costs. As long as prices remain unchanged, the inflation tax is costless to contributors: real money holdings are only eroded when money printing affects prices, something that usually happens with a time lag. This makes inflation taxes particularly attractive for politicians who want to reap short-term benefits and care little about how high the associated long-term costs may be. The inflation tax is, in other words, the canonical “election tax” because politicians can spend the revenues ahead of election but contributors will only pay the cost in terms of increased prices after the election.
TABLE 3: REAL SEIGNIORAGE, 2011-2021

In many prominent cases of historical hyperinflations, governments appeal to the inflation tax because they lack control over other policy instruments. For example, taxation may be controlled by the legislature, while lowering government spending is not feasible given the power of the constituents who benefit from that spending, including government workers. Lowering spending may also simply be infeasible if there are labor contracts or laws that prohibit the state from firing or lowering the nominal wages of state employees. If a government can’t reduce spending nor raise taxes but does control the monetary authority, then its only recourse may be to print money. Furthermore, printing money may be a way to reduce the budget deficit in the future by eroding away the value of government local currency debt as well as future government spending. Thus, all hyperinflations are eventually a form of delayed fiscal adjustment.
Figure 3: Real Seigniorage and inflation tax as percentage of GDP

Literature on the matter has typically observed a government’s incapacity to choose other policy alternatives as a leading cause for hyperinflations. In his seminal paper, Cagan (1956) claimed that governments resorted to inflation tax because: “In the unsettled conditions following the two world wars, governments were too weak to enact adequate tax programs and to administer them effectively.”
The inflation tax is the canonical “election tax” because politicians can spend the revenues ahead of an election but contributors will only pay the cost in terms of increased prices after the election.
One classic example is Bolivia’s hyperinflation during 1984 and 1985. This case occurred during the government of Hernán Siles Zuazo, who took office in after 18 years of military dictatorships and four years of political unrest that witnessed eight presidents take and leave office. A worsening international economic environment, with high-interest rates, falling commodities prices, political unrest, and high prior debt burdens incurred by the dictatorship of General Hugo Banzer barred Bolivia from international capital markets and ultimately led the World Bank and IMF to also cease lending. Siles inherited a declining economy with an annual inflation rate of approximately 300% and was unable to borrow on international markets.
As a first democratic government, Siles was called upon to satisfy many social-economic demands, exacerbated by the calls of its own leftist constituencies for expansionary policies. His government, however, lacked the support to raise tax revenues to fund such policies, as protesters and political rivals in Congress blocked or overturned his proposed stabilization programs. Seigniorage was the only policy that it could pursue unchallenged. The inflation tax caused a rapid rise in prices, reaching an annualized rate of 60,000% in August 1985, when Siles ultimately left office after accepting to reduce his own term. Stabilization would be carried out by a new administration with a greater mandate for fiscal adjustment (Sachs and Morales, 1987)
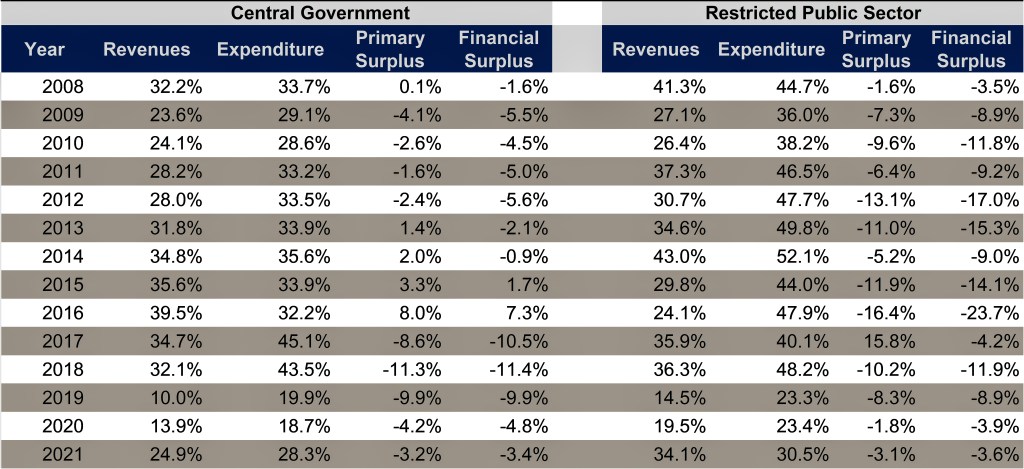
TABLE 4: FISCAL ACCOUNTS, 2011-2021
Venezuela’s case under Maduro was clearly not one in which the government lacked control over spending or taxation. In fact, it would be odd to refer to Venezuela as a weak government during the onset of hyperinflation, given that it controlled the Supreme Court and the army and had stripped the opposition-controlled Legislature of all its authority to legislate. Venezuela, like Zimbabwe in the 2000-2008 period, is a different case: rather than a weak government unable to adjust, it is a powerful state that decides to rely intensively on the inflation tax despite having many other choices at its disposal.
One explanation for this is the fact that the Venezuelan government was exposed to very frequent elections during this period, including legislative (2015), a recall referendum drive (2016), gubernatorial and mayoral (2017), and presidential (2018). As mentioned above, the inflation tax is the canonical “election tax” in that the front-loaded nature of its benefits allows policymakers to fund pre-election spending while shifting the cost through higher prices to contributors to the post-election period. As Figure 3 shows, the government reaped a high level of funding from the inflation tax in the 2015-18 period; after 2018 (the last election the government expected to be competitive), the inflation tax revenue fell to pre-2015 levels. Of course, it isn’t just elections that cause incentives for appealing to high levels of inflationary taxation; it is elections coupled with very high stakes of power that make the government party’s political survival highly contingent on electoral victories.
THE FIRE BRIGADE
Ultimately, hyperinflations reduce the deficit and thus take care of the problem that led to the emergence of hyperinflation – the need to print money to finance government spending. As discussed above, the deficit declines as a consequence of the growing inability of the inflation tax to pay for a significant fraction of government spending as local money holdings decline. In practice, runaway inflation can facilitate the decline of real government wages and spending levels. This is, in fact, what we see in Venezuela, with public sector spending falling from 33.8% of GDP in the 2012-2018 period to 22.3% of GDP in 2019-2021. Because the economy was shrinking, the decline is much greater when measured in real terms (73% between these two time periods).
In that sense, hyperinflations are like a fire. Ultimately, they come to an end when they run out of material to burn that can serve as fuel to the fire. Surely, whenever there is hyperinflation, there is also a government trying to stabilize prices. The fact that these stabilization programs exist doesn’t necessarily mean that they always put an end to the hyperinflation, in the same sense that the presence of a fire brigade doesn’t necessarily mean that the fire is coming to an end. Some fires are almost impossible to put out even for good fire brigades; others are not that hard to end even for the bad ones. Surely, good fire brigades can make the difference when there is a difficult fire, but even a bad fire brigade will manage to put out a fire that is running out of fuel. A hyperinflation that had already entered into its late stage (as of 2020, the deficit had fallen to levels consistent with sustainable public finances at 3.9% of GDP in 2020) is not that difficult to get out of. Nevertheless, doing so needed the application of a relatively restrictive monetary policy, implemented primarily through the application of very stringent reserve requirements in the 2018-2020 period.
There are usually two ways to get out of hyperinflation (as well as high inflation): tight monetary policy or pegging the exchange rate. Pegging the exchange rate is usually preferable as it can lead to an immediate economic expansion. However, it requires high levels of credibility to dissuade economic actors from staging a run on the currency. When I led the design of the government program of presidential candidate Henri Falcón in 2018, we suggested formal dollarization as the one way in which we could stabilize prices while also reaping the economic expansion of a credible peg despite the credibility problems that we were aware would plague any incoming administration.
Maduro’s was not a government that was too weak to adjust. It was a government that chose to rely intensively on the inflation tax despite having many other choices at its disposal.
In the absence of very high credibility (and remember, even very trustworthy politicians’ promises can be rendered incredible if people don’t expect them to remain in office), governments that want to put an end to high inflation often have to opt for tight monetary policy. This is almost guaranteed to throw the economy into recession – or, as happened in Venezuela, to deepen a recession driven by dwindling export earnings – yet is essentially the only way to regain some credibility for monetary policy. Tightening the supply of money will ultimately bring down inflation, at least as long as the resulting economic contraction does not bring down the government first.
Maduro opted for tight monetary policy. Because of interest rate controls, monetary policy in Venezuela is done through raising the amount of reserves that banks are legally obligated to hold in the central bank. In October 2018, the BCV increased both ordinary reserve requirements from 21.5% to 31% and marginal reserve requirements from 31% to 40%. Ordinary reserve requirements are the imposed reserve requirements over banking reserves, while marginal reserve requirements are those on reserves added after August 2018. Then, the BCV increased marginal reserve to 40% in December 2018 and 50% on January 9, 2019. On January 29, 2018, the BCV raised ordinary reserve requirements from 31% to 57% and the marginal reserve requirements to 100%. This measure effectively restricted, almost entirely, banks’ ability to lend since the hyperinflation caused most of the banks’ reserves to fall in the category of marginal reserves.
Policy began to be slowly eased as prices came down. In April 2020, the BCV removed marginal reserve requirements while increasing ordinary reserve requirements from 57% to 93%. On net, this decision reduced the reserve requirements from 100% to 93%. In January 2021, the BCV reduced the reserve requirements to 85%. Finally, on February 3, 2022, after formally exiting hyperinflation, Maduro announced a reserve requirements reduction from 85% to 73%, while the vice-president, Delcy Rodríguez, announced that the banks are allowed to lend 10% of their foreign exchange positions.
Hyperinflations don’t tend to recur in time (Zimbabwe’s relapse 14 years after stabilization being an unusual case meriting a discussion of its own), so it would be quite unusual to see Venezuela fall again into hyperinflation anytime soon. In fact, the levels of money demand are so low (real M2 today is equivalent to USD 1.1bn, or less than 2% of GDP) that there is little to gain for the government even of printing very large amounts of money. But the end of hyperinflation doesn’t mean that the structural problems that act as impediments to strong long-run growth have been addressed. It does mean that the government can no longer finance high spending levels through inflation tax and that it either must accept lower levels of spending or significantly raise tax rates. What remains most interesting about the future path of Venezuelan policies is to understand whether Maduro will accept the equilibrium of a small state and consequently greater scope for the private sector or will instead opt for much greater levels of taxation in order to fund the continued growth of state activities.
NOTES
[1] Cagan’s definition is often misinterpreted since it is necessary to wait 12 months to verify that an economy has exited hyperinflation, but the end date is recorded at the moment when inflation drops below the 50% threshold. Let’s think of the analogy of an illness: we can say that a person comes out of it when their fever falls below 100 degrees Fahrenheit, as long as their temperature remains below 100 degrees for at least the subsequent 24 hours.
[2] The BCV and 2015AN-OVF series have shown significant differences in the past. For example, the 2015AN’s estimate of 2018 inflation of 1.7 million percent was more than 12 times higher than that published by the BCV, of 131 thousand percent. However, on the timing of hyperinflation, they appear quite similar, with a difference of one month at the start and two months at the end of the phenomenon. The recent behavior of the series is similar as well: both series have put Venezuelan monthly inflation in the single digits for the past five months (from September 2021 to January 2022), with the 2015AN-OVF data showing a smaller average print for this period (6.6%) than the BCV (7.3%).
[3] See Iyer and Rodriguez (2021) for a discussion of the causes and precedents of Venezuela’s entry into hyperinflation.
[4] The term “Laffer Curve” earned somewhat of a bad name in recent years because of its association with supply-side economics. Yet few economists dispute that Laffer curves exist for all taxes; the substantive debate is whether the downward-sloping segment of the curve is relevant for most taxes. In the case of the inflation tax, there is little dispute that full-blown hyperinflations correspond to the downwards-sloping segment of the inflation tax Laffer curve.
